Whether it’s in reports or documentation, helping clients engage and understand the concepts and recommendations we’re making is part of a Paraplanner’s job.
Alongside the words you use in reports, graphics and illustrations can really help explain concepts and share key information with clients. But creating graphics that help you get across the information you want to share, while being pleasing to look at, isn’t easy. It can be a time consuming and frustrating process.
So, we thought we’d see if we could help out and we asked our supporters, Parmenion, whether they’d be happy to work with us on an idea.
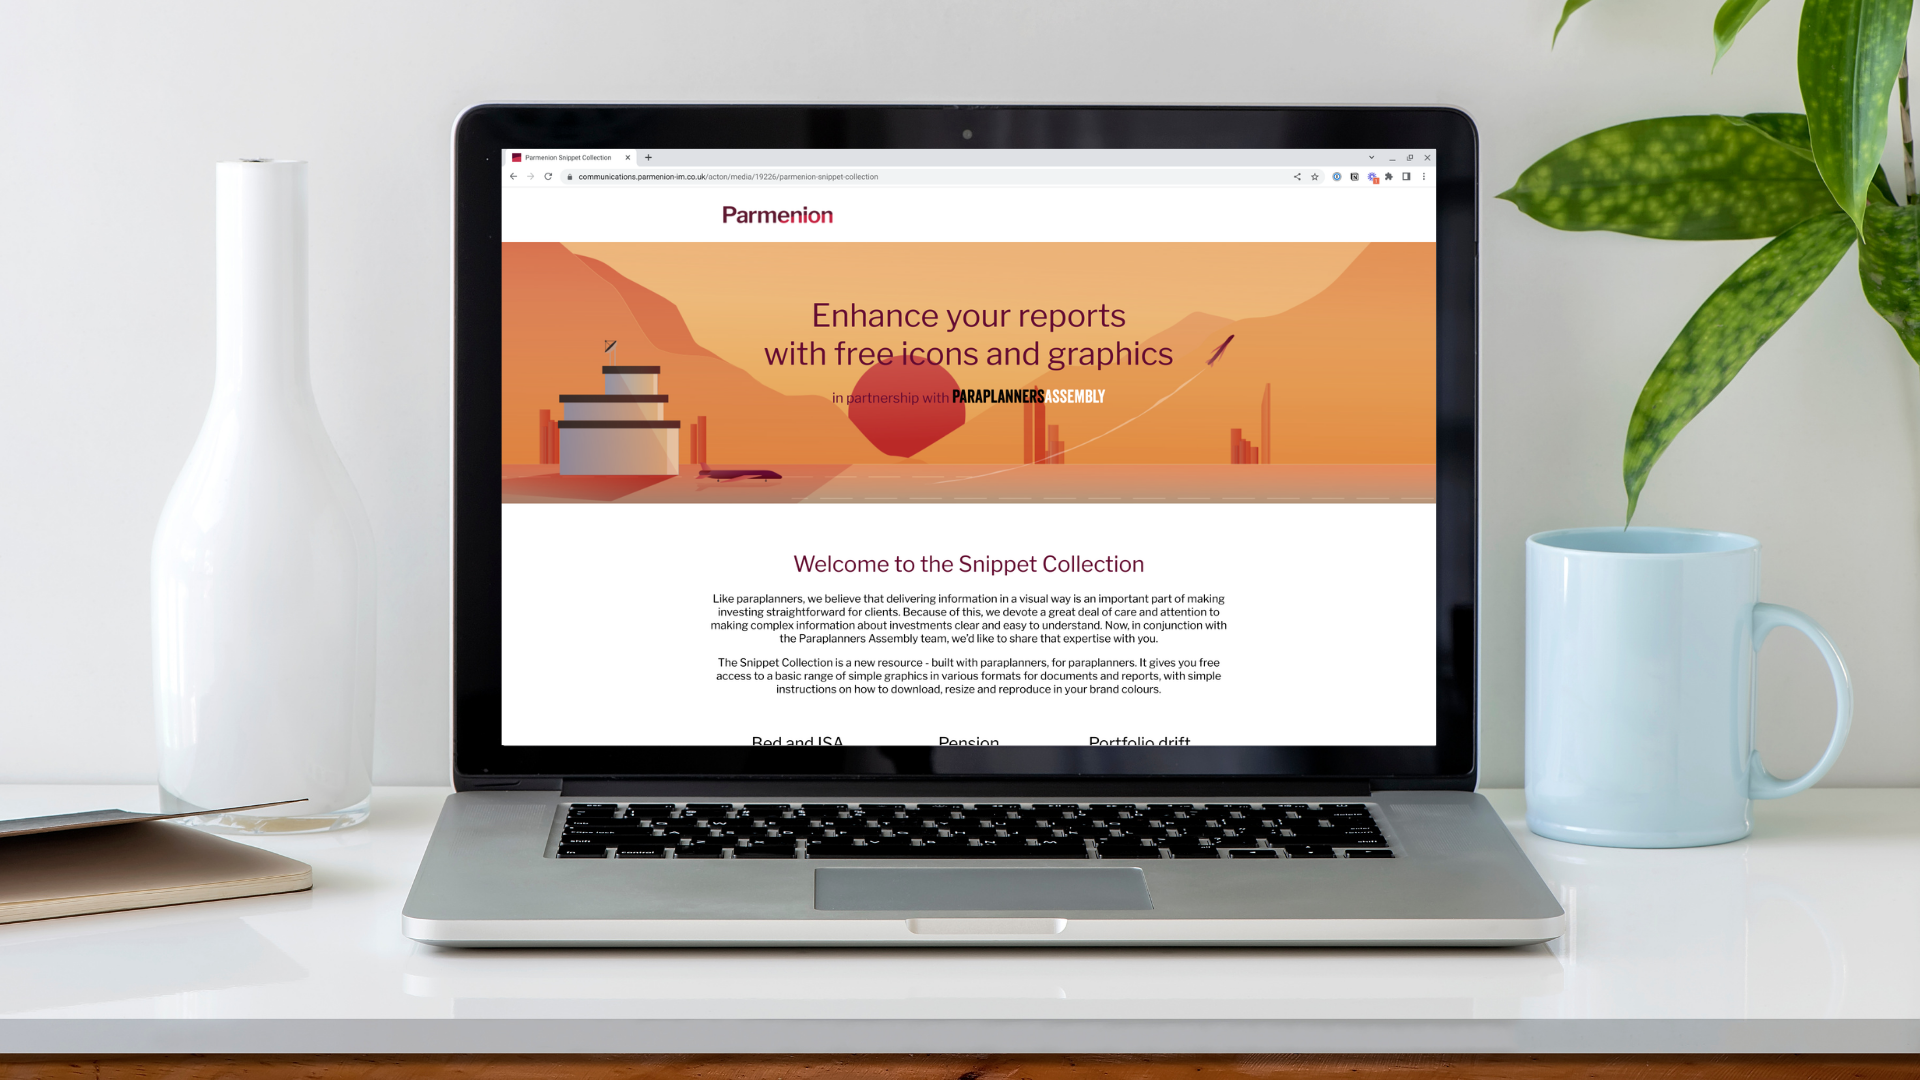
The snippet collection
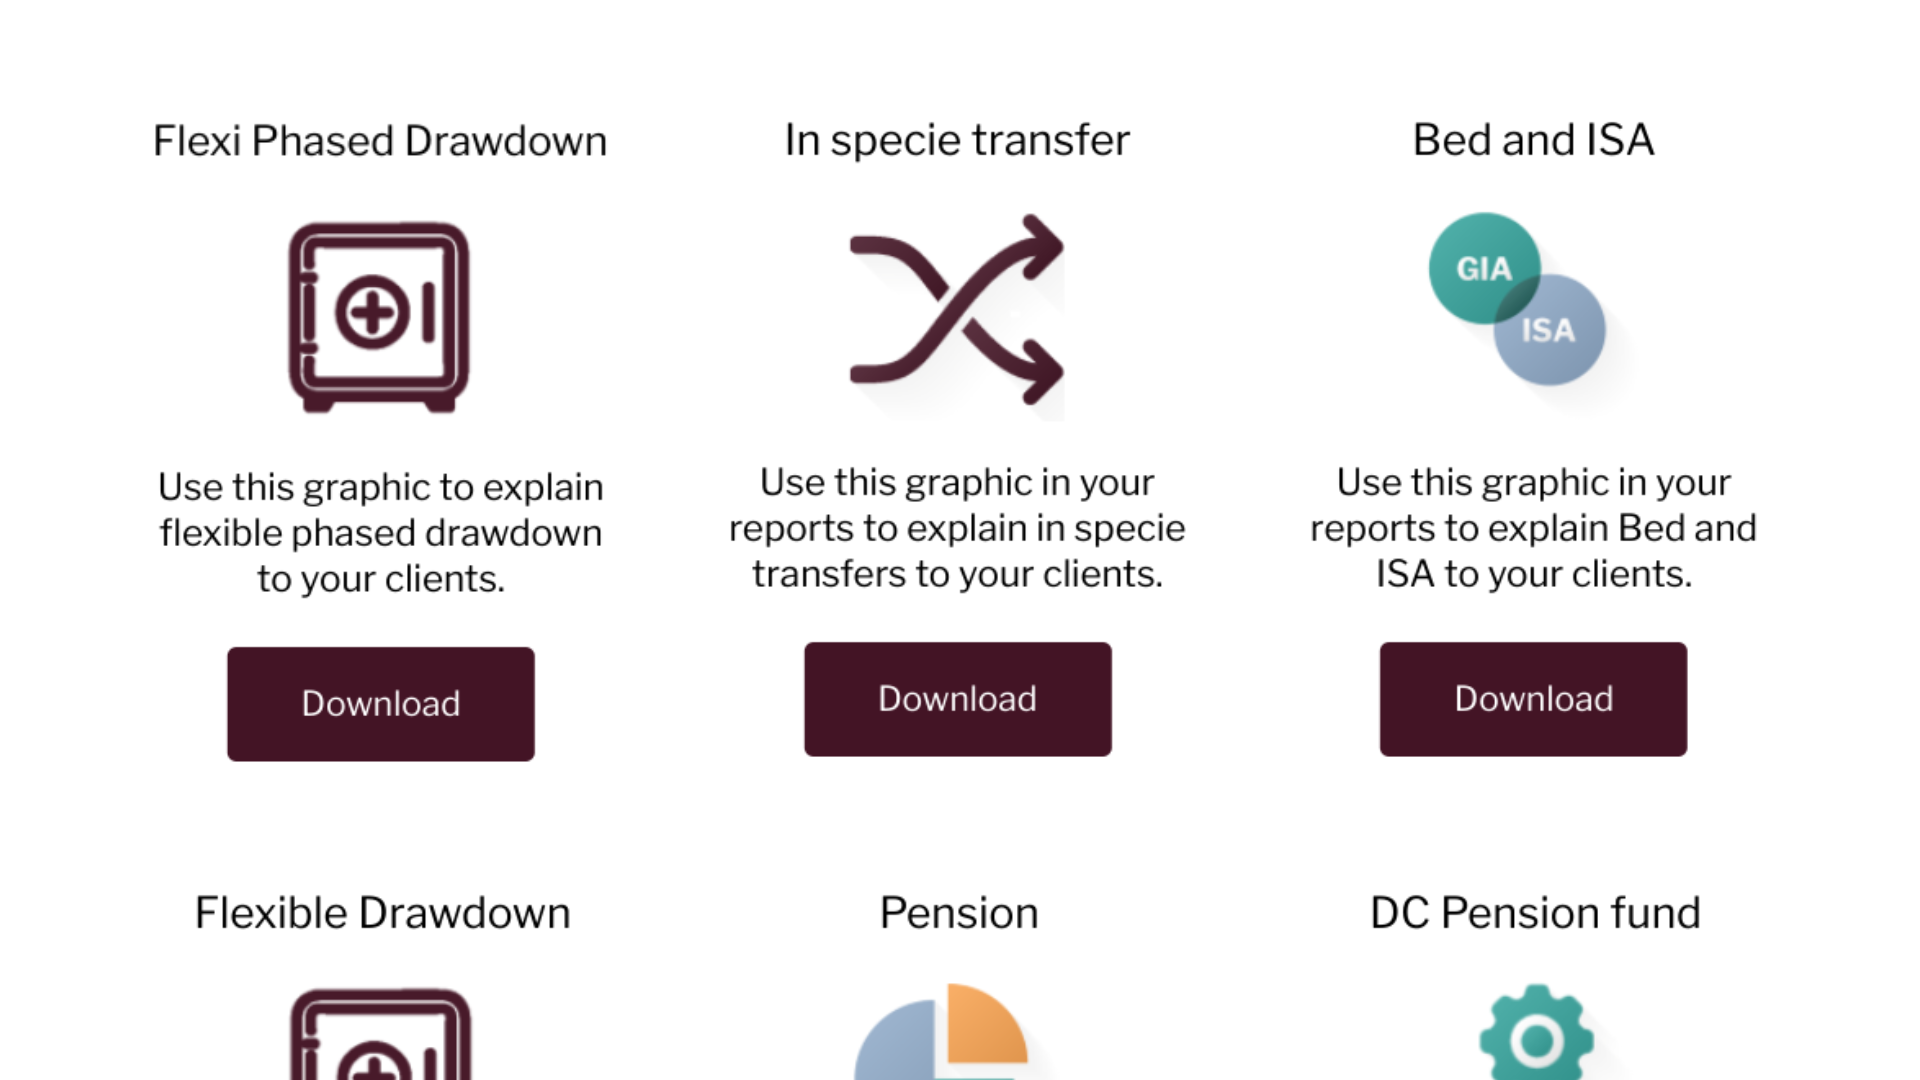
The Snippet Collection is a new resource that gives you free access to a basic range of simple graphics in various formats for documents and reports, with simple instructions on how to download, resize and reproduce in your brand colours.
It’s a limited collection to start with and, as you make further requests, we’ll develop it, adding further graphics based on demand.
With the Snippet Collection, we want to:
- Furnish you with free graphics for use in reports to clearly explain the concepts and information you want to share with clients
- Make it easy for you add graphics to Word documents with the guidance provided by Word expert, Melanie Francis. If you use other systems to create your reports or documentation and think we can provide similar guidance, we’d love to hear about them. You can let us know in the survey.
- Make sure the graphics we develop are the ones you need, so you have plenty of opportunity to let us know what would help you.
Richard shares a little more about the collection in this video.
Start using the snippet collection
Like anything, knowing when to put something out into the world is hard. There’s loads we’d like to add to the snippet collection and we could spend ages perfecting it but we’re going for progress over perfection and opening it up to you now. We hope that, as you start to use it, you’ll help us perfect it. That’s why it’s really important you share any ideas you have, or improvements you’d like us to look at. We’ve added a feedback survey to the collection for you to this.
So, what are you waiting for? Get stuck in. Use the graphics in your reports and share your thoughts with us.
Take a look at the collection now.
Digging deeper into report design
Perhaps you’d like to broaden your knowledge of designing client reports? A while back we had a conversation with designer, Mike Bond, about creating great looking reports. Watch it here.
While we’re talking about great reports, the words are just as important as the layout and images. We spoke to Simon Grover from Quietroom, about writing financial documents. Catch up here.
Thank you
We’ve been working on this for a while now and we want to thank Dan Atkinson and Rebecca Tuck for bringing their paraplanning experience and knowledge to this idea. We also want to thank the team at Parmenion for their time and design expertise.